Another Measure of Political Polarization
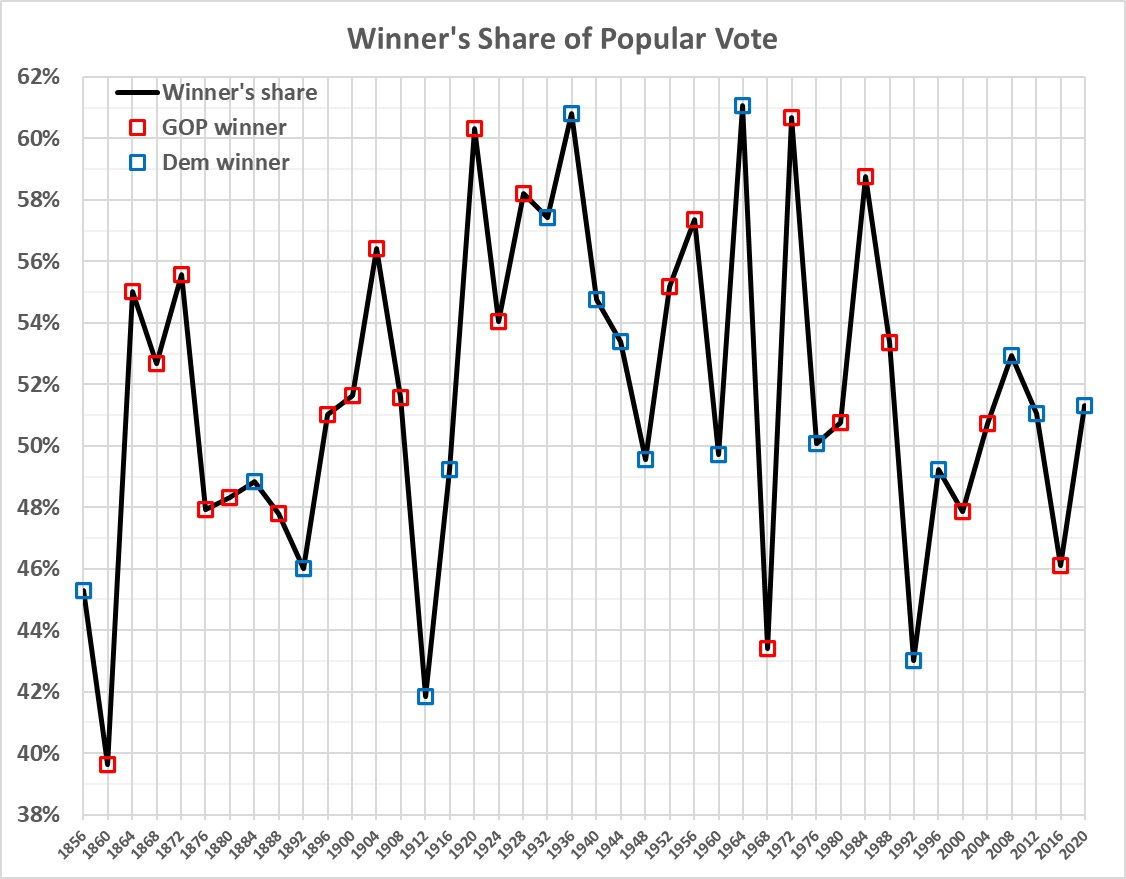
The winner’s share of the popular vote in presidential elections.
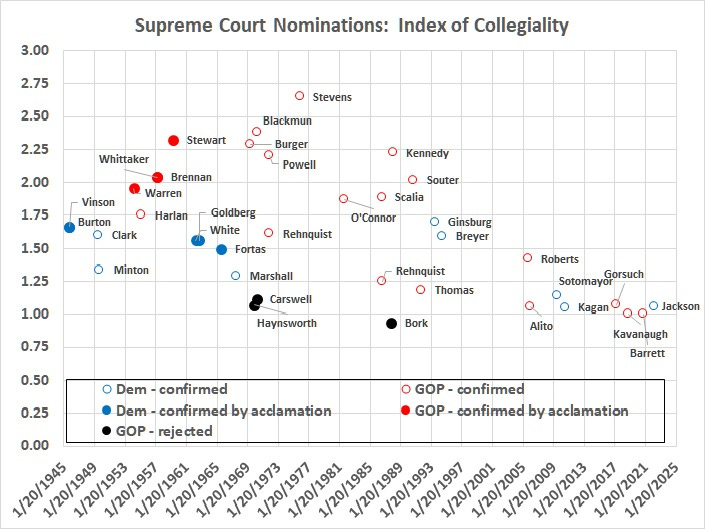
In “A Measure of Political Polarization: The Decline of Collegiality in the Confirmation of Justices“, I concocted an index of collegiality for the confirmation of U.S. Supreme Court justices:
C = Fraction of votes in favor of confirming a nominee/fraction of Senate seats held by the nominating president’s party
A C score greater than 1 implies some degree of (net) support from the opposing party. The higher the C score, the greater the degree of support from the opposing party.
Examples:
Tom Clark, nominated by Democrat Harry Truman, was confirmed on August 18, 1949, by a vote of 73-8; that is, he received 90 percent of the votes cast. Democrats then held a 54-42 majority in the Senate, just over 56 percent of the Senate’s 96 seats. Dividing Clark’s share of the vote by the Democrats’ share of Senate seats yields C = 1.60. Clark, in other words, received 1.6 times the number of votes controlled by the party of the nominating president.
Samuel Alito, nominated by Republican George W. Bush, was confirmed on January 31, 2006, by a vote of 58-42; that is, he received 58 percent of the votes cast. Republicans then held 55 percent of the Senate’s 100 seats. The C score for Alito’s nomination is 1.05 (0.58/0.55).
The index, which I computed for nominations since World War II, looks like this:
My commentary:
C peaked in 1975 with the confirmation of John Paul Stevens, a nominee of Republican Gerald Ford. (One of many disastrous nominations by GOP presidents.) It has gone downhill since then. The treatment of Brett Kavanaugh capped four decades of generally declining collegiality.
The decline began in Reagan’s presidency, and gained momentum in the presidency of Bush Sr. Clinton’s nominees fared about as well (or badly) as those of his two predecessors. But new lows (for successful nominations) were reached during the presidencies of Bush Jr., Obama, Trump, and Biden.
There’s another measure of political polarization, one that might be said to capture the general mood of the electorate. That measure is the share of the nationwide popular vote that has accrued to the winner of each presidential election. The nationwide popular vote is irrelevant to presidential elections because of the electoral college (see this post and this one). But the tally has some value as an indicator of the degree of divisiveness among the electorate.
Here are the numbers since the inception of the Republican Party in 1856:
The sharp dips were caused by the good showing of third parties (and sometimes fourth and fifth parties).
What I find interesting is the era of “big wins”, which began in 1920 and ended in 1984. It wasn’t an era of big wins by one party. Voters were (then) quite willing to flock to a Democrat or Republican when they were fed up with incumbent president of the other party for whatever reason (policies, economics, scandals, etc.).
A clearer picture emerges when the winner’s share is averaged over three elections:
By this measure, “national collegiality” peaked in the 1920s-1930s and remained high through the 1980s. It has since declined to a level similar to that of the rancorous and volatile post-Civil War era — the era that saw the rise of “progressivism”, which again poisons political discourse and stifles economic progress.


