

Baseball's Greatest Hitters for Average
Baseball's Greatest Hitters for Average
Something to chew on (bubblegum, of course).

I published several posts at my old blogs about the American League’s greatest hitters for average: here, here, here, here, and here. The analysis that underlies the findings in those posts is complex — and unnecessarily so. In the last of the posts, I address and dismiss another writer’s exceedingly complex approach to the question of who was the greatest hitter.
That writer and I are both guilty of having glossed over the statistical uncertainties that arise from complex approaches that try to account for such differences as these (and others):
Ballpark advantage/disadvantage (a broad measure that doesn’t reflect individual hitting patterns and adjustments)
The (apparent) downward trend in reaction time (a mass phenomenon, if true, but one that may not apply to the best ballplayers of various generations)
Age (which must matter, but the effect isn’t uniform).
I am therefore reverting to a simple method that paints a broad picture of relative batting prowess.
I am also including National League hitters. Thus the title of this post.
Here’s my new method:
To be considered, a player must have won at least two batting titles.*
I computed for each player (list below**) a series of centered, three-year batting averages for three-year spans in which the player averaged at least 400 plate appearances a season. I used three-year averages to “smooth” year-to-year ups and downs and weed out one-year wonders.
To normalized the raw batting average, I computed a series of centered, three-year league batting averages for each major league.
I adjusted the AL averages downward (by .0067) for the years 1973 through 2022, to account for the rise in the league batting average with the AL’s adoption of the designated-hitter rule in 1973.***
I divided the centered, three-year averages for each player (step 2) by the corresponding centered, adjusted, three-year league averages (steps 3 and 4). The resulting value (e.g., 1.25) indicates how well the player hit for the three years (plotted against the middle year) relative to the league average for the same three years (e.g., 1.25 = 25 percent above the league average).
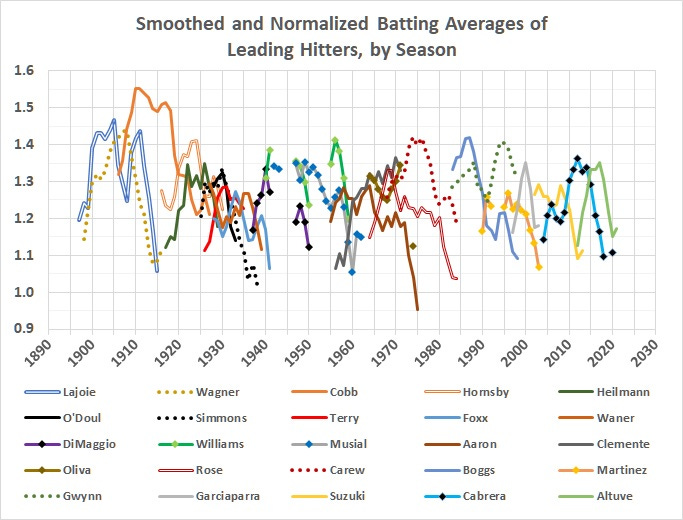
Figure 1 is a chronological comparison of the adjusted averages for each player who had the highest average at least once. The legend lists the players in the order in which they first attained the highest average.
FIGURE 1
Here’s how many times each player attained top rank:
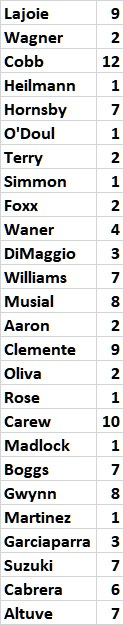
Altuve’s total — and possibly Cabrera’s — will drop as new names join the list of those eligible for consideration.
Figure 2 offers an age-based comparison, for what it’s worth. It certainly simplifies matters.
FIGURE 2

Figure 2 highlights Cobb’s dominance. The rest of the players, except for Rose and Yastrzemski are there on merit. Rose and Yaz simply persevered.
Rose, for many reasons, deserves obloquy. I will restrict my remarks here to Rose’s mistakenly praised accomplishment of compiling more hits than Cobb did: 4,256 vs. 4,189. Rose had 14,053 at-bats to Cobb’s 11,440. If Rose had hit .366 (as Cobb did), he would have compiled 5,146 hits, 890 more than his actual total. Here’s another way to look at: If Rose had compiled 4,189 hits in his first 11,440 at-bats (as Cobb did), he would have gone 67 for 2,613 in the rest of his career — a risible average of .026.
A final note: Ted Williams’s record would shine more brightly if he hadn’t missed most of five seasons to military service during World War II and the Korean War. He will come to the fore when I get to all-around hitters — batsmen who hit for high average with power.
* I made exceptions for Babe Ruth and Lou Gehrig, who each won one title but are legends of the game. Nor could Shoeless Joe Jackson be neglected. I also made exceptions for Mickey Mantle and Al Kaline, who each won one title and had long, outstanding careers. I rejected Larry Walker, who derived the unquestionable benefit of playing almost half of his games in Coors Field, where there’s plenty of room to hit the ball where the outfielders aren’t — and into the stands because of Denver’s thin air. I also rejected Barry Bonds and Manny Ramirez of PED infamy. (Though Ramirez had only one batting title, he enjoyed a long, high-average, but tainted career.)
** Here’s the list of batters I considered, with the spans of their major-league seasons in parentheses. The links lead to their pages at Baseball-Reference.com, from which I drew all the statistics used in this analysis:
Nap Lajoie (1896-1916)
Honus Wagner (1897-1917)
Ty Cobb (1905-1928)
Joe Jackson (1908-1920)
Jake Daubert (1910-1924)
Edd Roush (1913-1931)
Harry Heilmann (1914-1932)
Babe Ruth (1914-1935)
Rogers Hornsby (1915-1937)
Lefty O’Doul (1919-1934)
Bill Terry (1923-1936)
Lou Gehrig (1923-1939)
Al Simmons (1924-1941)
Jimmie Foxx (1925-1945)
Paul Waner (1926-1945)
Joe DiMaggio (1936-1951)
Ted Williams (1939-1960)
Stan Musial (1941-1963)
Ferris Fain (1947-1955)
Richie Ashburn (1948-1962)
Pete Runnels (1951-1964)
Mickey Mantle (1951-1968)
Al Kaline (1953-1974)
Hank Aaron (1954-1976)
Roberto Clemente (1955-1972)
Carl Yastrzemski (1961-1983)
Tony Oliva (1962-1976)
Pete Rose (1963-1986)
Rod Carew (1967-1985)
Bill Madlock (1973-1987)
George Brett (1973-1993)
Wade Boggs (1982-1999)
Tony Gwynn (1982-2001)
Edgar Martinez (1987-2004)
Nomar Garciaparra (1996-2009)
Ichiro Suzuki (2001-2019)
Miguel Cabrera (2003-present)
Jose Altuve (2011-present)
I began with Lajoie and Wagner because of their prowess and also because their careers substantially overlapped the early years of the American League. Lajoie started in the NL, but ended up playing most of his games in the AL.
*** The DH adjustment is .0067, which is the difference between the changes in the American and National Leagues’ averages between two spans: 1901-1972 and 1973-2022. The AL average increased slightly — by .0003 between 1901-1972 and 1973-2022. But the NL average dropped by .006 between those two spans. I attribute the difference of .0067 to the AL’s adoption of the DH.