

Is the Bear Market Over?

A bear market is usually defined as decline of at least 20 percent in a broad stock-market index. The S&P 500 index topped out at 4818.22 in January 2022, dropped to 3636.87 in June, rose to 4325.28 in August, dropped to 3491.58 in October — the low (to date) for the current bear market, 27 percent below the January peak.
Since then, the index has risen, dropped, and risen again. Today’s high of 4195.44 leaves the index only 13 percent below its peak. Technically, the market is no longer in bear country, but that doesn’t mean that the bear market is over.
Here’s the story to date:
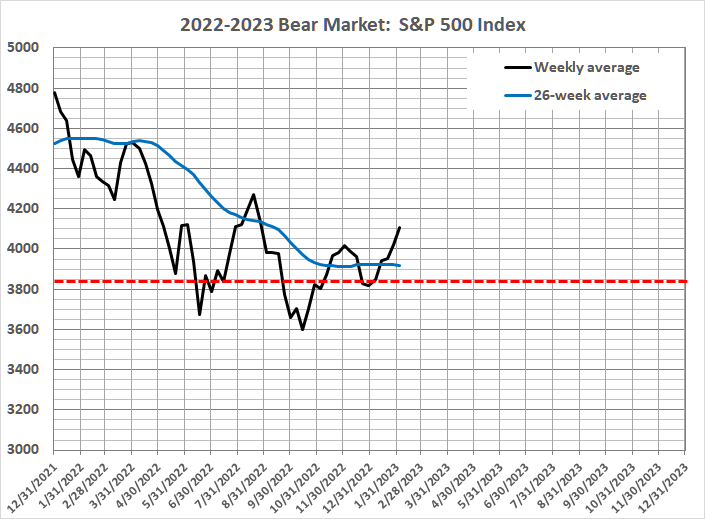
The dashed red line is 20 percent below the January 2022 high. The meandering route of the weekly average (which I use for analysis of long-term trends) has taken the index above the “magic” 20-percent line more than once.
But the end of a bear market isn’t confirmed until two things happen. The first is that the 26-week average turns up and continues to rise for at least 13 weeks. That hasn’t happened, yet. And it may not happen for a while. The low (to date) occurred after the impressive rally of June-October 2022.
The second indicator is the value of a volatility index that I have concocted. It hasn’t dropped into bull-market territory yet. But it can drop suddenly — and unpredictably.
As the man said the market is a random walk down Wall Street. Anything can happen, and it usually does: war, riot, natural disaster, political turmoil, unexpectedly bad or good economic news, etc., etc., etc.
Stay tuned.