

The Bad News and Bad News about Major-League Baseball
The Bad News and Bad News about Major-League Baseball
It's a less competitive yawn-fest.

I once declared baseball the “king of team sports”. But I would agree with anyone who says that baseball is past its prime. When was that prime? Arguably, it was the original lively ball era, which by my reckoning extended from 1920 through 1941. The home run had become much more prevalent than it was in the dead-ball era (1901 through 1919, in the American League). But the home run did not become so prevalent that it dominated offensive strategy. Thus batting averages were high and scoring proceeded at a higher pace than in any of the other eras that I’ve identified.
In 1930, for example, the entire National League batted .303. The Chicago Cubs of that season finished in second place and batted .309 (not the highest team average in the league). The average number of runs scored in a Cubs’ game was 12.0 — a number surpassed only by the lowly Philadelphia Phillies, whose games yielded an average of 13.8 runs, most of them scored by the Phillies’ opponents. Despite the high scoring, the average Cubs game of the 1930 season lasted only 2 hours and 5 minutes. (An estimate that I derived from the sample of 67 Cubs’ games for which times are available, here.)
In sum, baseball’s first lively ball era produced what fans love to see: scoring. A great pitching duel is fine, but a great pitching duel is a rare thing. Too many low-scoring games are the result of failed offensive opportunities, which are marked by a high count of runners left of base. Once runners get on base, what fans want (or at least one team’s fans want) is to see them score.
Baseball has declined since the first lively ball era, not just because the game has become more static — get on base and wait for a home run — but also because it now unfolds at a much slower pace. The average length of a game reached 3 hours in 2012, and has yet to fall below that benchmark. As recently as 1946, the average game was an hour shorter. And it was even shorter in the dead-ball and early live-ball eras:

Derived from this page at Baseball-Reference.com.
The other big problem with baseball is in its competitiveness — or growing lack thereof. Consider this graph, which I will explain and discuss:
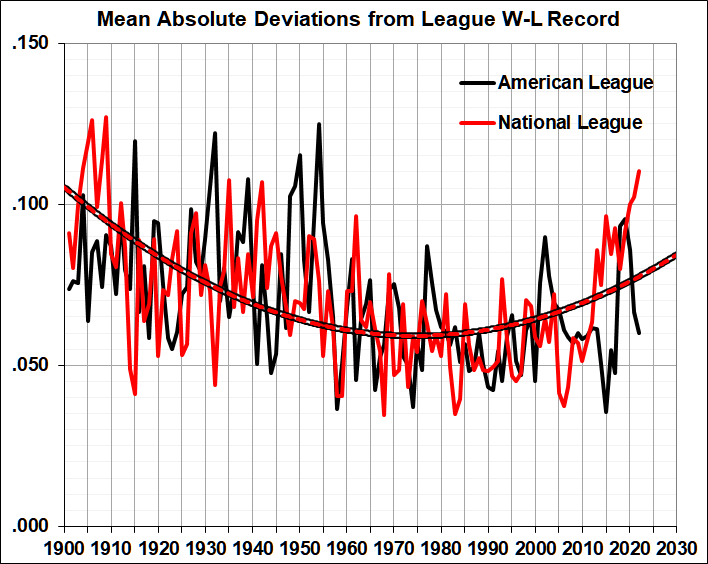
Based on statistics for the National League (NL) and American League (AL) compiled at Baseball-Reference.com.
Though the NL began play in 1876, I have analyzed its record from 1901 through 2022, for parallelism with the AL, which began play in 1901. The similarity of the two time series lends weight to the analysis that I will offer shortly.
First, what do the numbers mean? The deviation between a team’s won-lost (W-L) record and the average for the league is simply Dt = Rt – Rl , where Rt is the team’s record and Rl is the league’s record in a given season.
If the team’s record is .600 and the league’s record is .500 (as it always was until the onset of interleague play in 1997), then Dt = .100. And if a team’s record is .400 and the league’s record is .500, then Dt = -.100. Given that wins and losses cancel each other, the mean deviation for all teams in a league would be zero, or very near zero, which wouldn’t tell us much about the spread around the league average. So I use the absolute values of Dt and average them. In the case of teams with deviations of .100 and -.100, the absolute values of the deviations would be .100 and .100, yielding a mean of .100. In a more closely contested season, the deviations for the two teams might be .050 and -.050, yielding a mean absolute deviation of .050.
The smaller the mean absolute deviation, the more competitive the league in that season.
The mean absolute deviations change a lot from season to season, so I added polynomial regression lines (the curved lines), which help to distinguish long-term trends from annual “noise”. Remarkably, the regression lines for the NL and AL are identical; the red line for the NL data series nestles precisely in the center of the double black line for the AL data series.
The regression lines suggest that both major leagues became more competitive from the early 1900s until about 1975. The raw numbers suggest that the leagues remained relatively competitive until about 2000. In any case, the trend reversed — with a loud bang in the NL and erratically but emphatically in the AL.
Unfortunately, the trend toward greater competitiveness reversed even as games continued to grow longer. Thus my characterization of major-league baseball as a less-competitive yawn-fest.
Baseball is sometimes called a metaphor for life. (It’s a better metaphor than soccer, to be sure.) I venture to say that the decline of baseball is a metaphor for the decline of liberty in America, which began in earnest — and perhaps inexorably — during the New Deal, even as the first lively ball era was on the wane.