

The Present Inflationary Episode in Perspective
The Present Inflationary Episode in Perspective
It's an ugly sight.

Going back to 1946, the first year of peace after the end of World War II, the history of the consumer price index looks like this:

Year-over-year inflation looks like this:
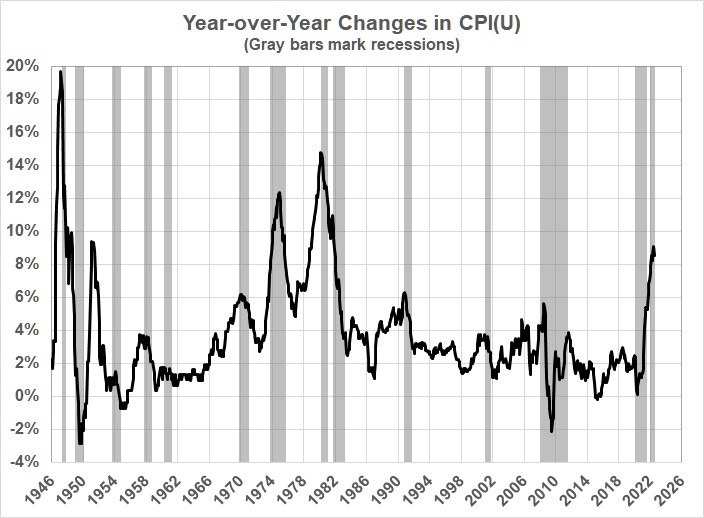
Year-over-year inflation in 1946-48, 1973-75, and 1979-81 was higher than the recent rate of inflation. But the recent rate of change in inflation is higher than it has been since the end of World War II. (See the slope of the curve in the first graph.)
From January 1946 to January 2021, the annualized rate of inflation was 3.6 — a rate that includes the aforementioned periods of high inflation (reaching 19.7 percent, year-over-year). From July 1983 (the end of the Fed-induced recession that tamed inflation) to January 2021, the annualized rate of inflation was 2.6 percent.
From that low-inflation base, the rate of inflation jumped to 8.7 percent (annualized) for the period from January 2021 to July 2022. The rate may be lower than it was in earlier high-inflation periods, but it is high enough to throw the economy for a loop.
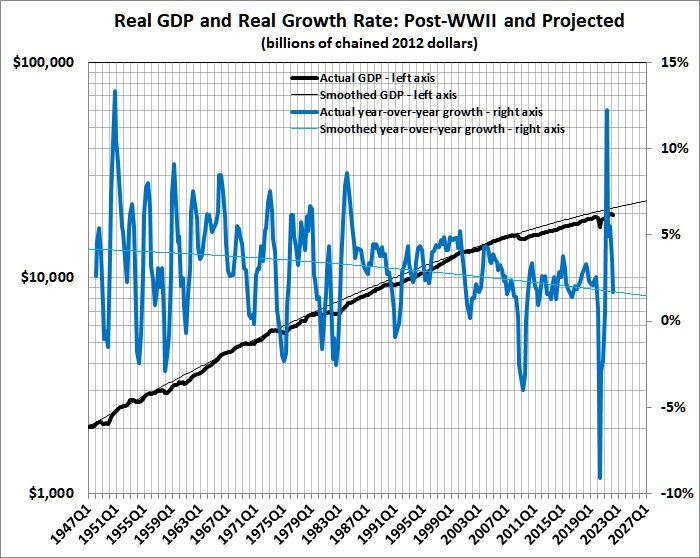
First, according to the equation that I derived here, a sustained increase of 6 percentage points would reduce the rate of growth in real GDP by 1 percentage point a year. That would be quite a blow to an economy that has slowed to a real growth rate of about 2 percent a year:
Then, throw in the lingering effects of futile and economically devastating government-imposed measures to combat COVID and to restrict the production and use of fossil fuels. Mix those ingredients with renewed enthusiasm for regulation and higher corporate and individual income taxes and you have a perfect setup for continued stagnation if not a prolonged recession.
That’s on top of the mega-depression in which America has been mired for more than a century.
Feeling better now that Trump has been replaced by an anti-business, anti-growth president?