

The Real Story about Economic Growth
The Real Story about Economic Growth
It's not good.

Sort-of-economist Timothy Taylor, who edits the Journal of Economic Perspectives and blogs as the Conversable Economist, has posted “The Remarkable Steadiness of Economic Growth”, in which he asserts:
It is remarkable but true that per capita US economic growth has hewed close to a trendline of 2% per year for the last 150 years. Here’s a recent figure showing this pattern from Charles Jones in his paper “The Outlook for Long-Term Economic Growth,” as prepared for the annual symposium at Jackson Hole hosted by the Federal Reserve Bank of Kansas City (August 2023, full symposium proceedings including Jones’s paper available here, Jones’s paper also available as NBER Working Paper #31648).
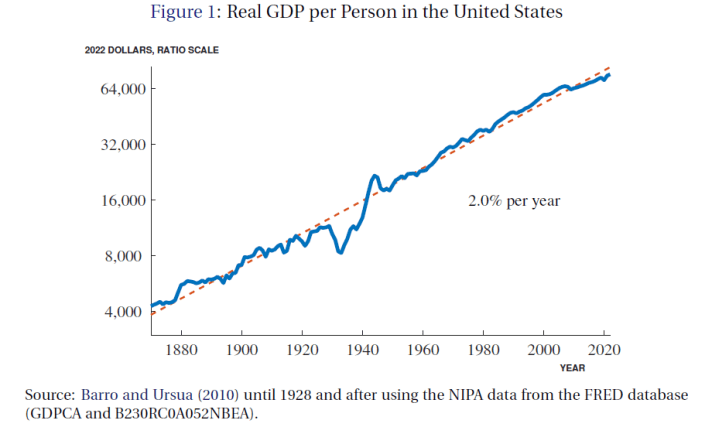
Notice that the left-hand axis of the figure is a logarithmic (that is, a proportional) scale. On such a scale, a 2% growth rate appears as the straight dashed red line. The path of the US economy has sometimes been a little above this line, and sometimes a little below below. But the fact that the 2% annual growth rate fits the long-term pattern so well is quite remarkable.
I would laugh at the “path of the US. economy sometimes has been … a little below” the regression line, if the downward deviations were of little consequence to actual persons. But all of them were consequential. The “dip” from 1929 to 1933 (a.k.a. the first years of the Great Depression) marks a drop in real GDP per person of 29 percent. Other dips, which look small on a graph, were also large and damaging to the well-being of tens of millions of Americans: 1891-94, 14 percent; 1907-08, 12 percent; 1945-47, 17 percent; 2009-10, 3.5 percent; and 2019-20, 3 percent. Those percentages mask the greater pain which befell Americans who bore the brunt of economic downturns — almost always Americans who were already in the bottom tiers of the economic scale.
More to the point of Taylor’s post, he should know better than to claim that a regression line says anything about long-term growth. If you start at 1790 instead of 1870 (as Taylor’s source does), you get a regression line which suggests that long-term real growth has been 1.7 percent:

Derived from U.S. GDP statistics at Measuring Worth.
That’s significantly different than 2 percent. Over a span of 100 years for example, total growth at 1.7 percent is only 75 percent of total growth at 2 percent.
Moreover, it’s naïve (or disingenuous) to claim that long-term growth approximates any particular rate. It all depends on the period of interest. For example, if I select 1796-1829, 1829-1933, 1933-1947, 1947-2009, and 2009-2020, as periods of interest, I get significantly different rates of growth for each of them — and significant fluctuations in actual growth during each period:
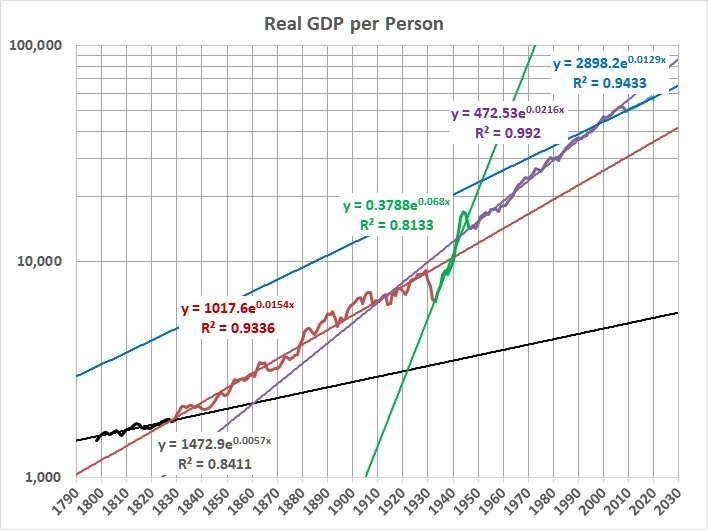
Source: As above.
Translating the regression equations:
1796-1829, 0.6 percent
1829-1933, 1.5 percent
1933-1947 (which reflects recovery from a devastation depression and the huge growth in defense spending during World War II), 6.8 percent
1947-2009, 2.2 percent
2009-2020, 1.3 percent
Most of those values are significantly different from 1.7 percent for the 1790-2022 span (second graph above).
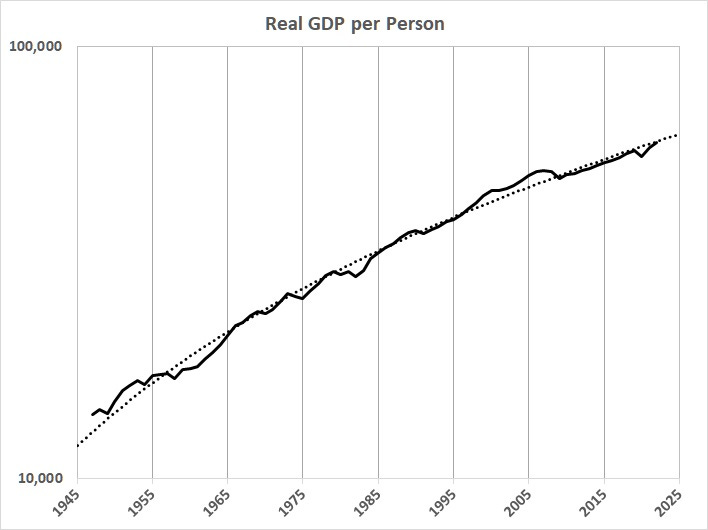
Here’s another way to look at it. If Taylor had been writing about 1870-1944 (and ignored the meaningless jump in GDP during World War II), he would have said the long-term rate of real GDP growth per person has been 2.3 percent a year. That’s a lot higher than the 2 percent that he “brags” about. But … the subsequent rate for 1944-2022 was only 1.6 percent, which is a lot lower than the 2 percent that he “brags” about. (Remember the example of the cumulative difference between rates of 2 percent and 1.7 percent.)
Finally, what’s really happening is that GDP growth is slowing because of the cumulative effects of government spending and regulation, which I document here. The decline in the rate of growth is evident here:
And it isn’t going to get better until (and unless) the leftists who are ruining the nation are taken out and shot.