

Trump vs. Biden: 2

There are two important aspects of presidential elections that must be borne in mind and accommodated in estimating the outcome of a particular election. First, there is the slight edge enjoyed by Republicans in the electoral college. This is illustrated in the following graph of electoral-vote share vs. popular-vote share in the last 10 presidential elections:
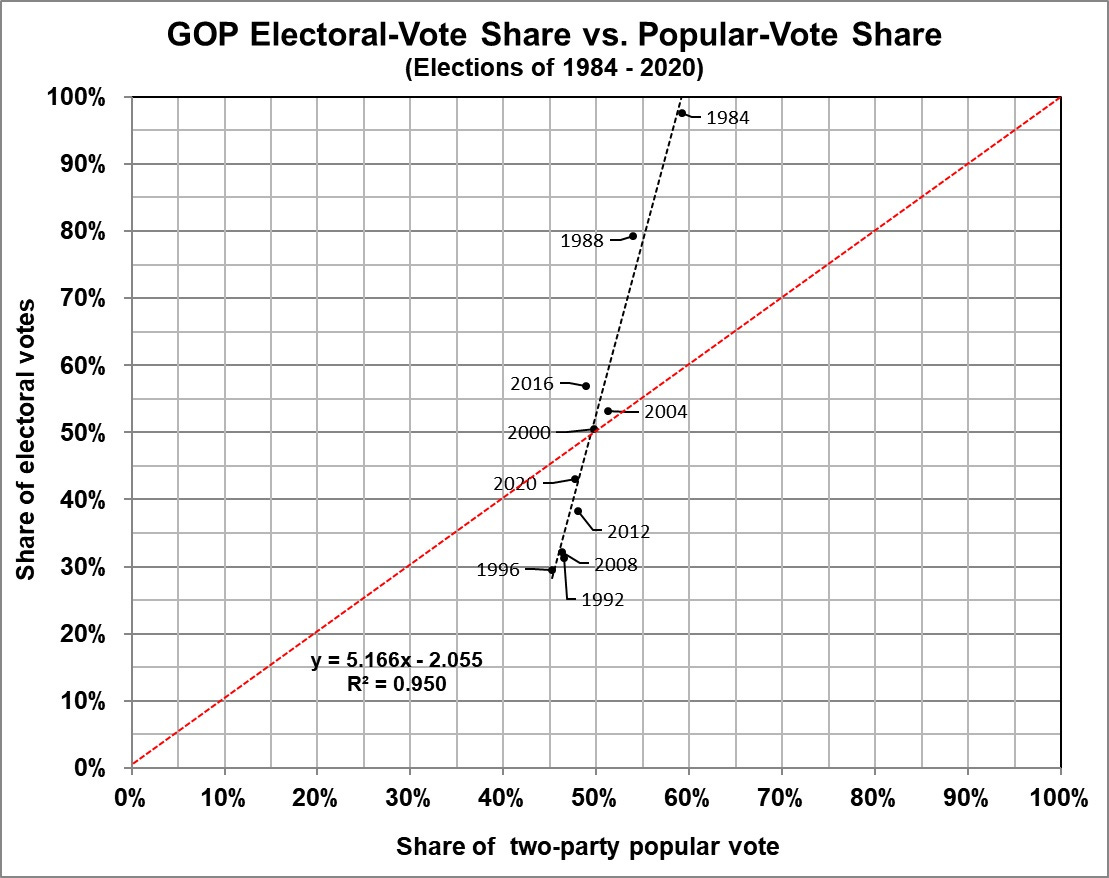
A candidate’s share of the electoral doesn’t change in proportion to his share of the nationwide popular vote. (The dashed red line depicts a proportionate relationship.) That is because all of the States (but two) and D.C. have a winner-take-all method of allotting their electoral votes. In those cases, a candidate wins all of the jurisdiction’s electoral votes whether he wins the popular vote by 0.1 percent or 10 percent. And a slight change in the candidate’s popular vote — from 49.9 percent to 50.1 percent, say — swings the entire block of electoral votes.
Look closely at the regression line in the graph and you will see that it doesn’t cross the dashed red line at the 50-50 mark. Rather, a GOP candidate (on average) can win 52.3 percent of the electoral votes with 49.9 percent of the nationwide popular vote. That’s because the smaller States — a majority of which lean GOP — are disproportionately represented in the electoral college. The upshot is that a candidate who wins the most States has an electoral-college advantage. Throw in some close wins in larger States and you have what looks like a resounding victory; for example, in 2016 Trump won 56.9 percent of the electoral votes with 48.9 percent of the two-party popular vote, nationwide.
Therefore, if a Democrat leads in a poll that purports to be representative of voters across the nation, that lead is overstated because a nationwide tally is doesn’t reflect the distribution of electoral votes.
Moreover, a lot of polls are biased toward Democrats. As of today, for example, the poll of polls at RealClearPolitics gives Trump an average lead of 0.5 percentage point over Biden. That estimate is based on 12 polls. Adjusting the results for the pollsters’ biases — as measured by 538 — Trump’s lead doubles. And, as discussed above, a little bit means a lot.
More to come.
Good point. However, the compact doesn't have all 270 votes yet. And all of the states that have joined the NPVIC are Blue, so the NVPIC won't change the outcome unless joined by a Purple or Red state. Moreover, the constitutionality of NVPIC is in doubt, and it might require the approval of Congress. If the GOP controls at least one chamber, such approval might not be forthcoming. As of now, then, the electoral vote is slightly biased toward the GOP candidate.
The NPVIC can turn the electoral college. As of January 2024, the NPVIC has been adopted by sixteen states and the District of Columbia. Together, they have 205 electoral votes, which is 38.1% of the Electoral College and 75.9% of the 270 votes needed to give the compact legal force.