

Trump vs. Biden: 9

UPDATED 03/18/24 - 03/21/24
Something has been nagging me about the poll numbers that I've compiled and reported in several previous posts (e.g., here). That something is the lack of an adjustment for political bias. I've been reporting the statistical margin of error, but that's not the same thing.
Every poll, biased or not, has a margin of error, which is a statistical measure related to sample size. But what the pollsters don't tell you is that a margin of error, properly understood, is just an estimate of the accuracy of the polling results -- assuming a random (unbiased) sample. That's not what you get from most polls, which are designed (often deliberately) to slant results toward the candidates of a certain party -- usually the Democrat Party. A margin of error doesn't account for bias.
In 2008, Bush's average margin for polls conducted in the seven days before election day (with no double-counting of pollsters) understated Bush's margin in the nationwide popular-vote tally by 1.0 percentage point. Similar analysis for succeeding elections yielded these result: Obama 2008, overstated by 0.1 percentage point (effectively equal); Obama 2012, understated by 3.2 percentage points; Clinton 2016, overstated by 1.6 percentage points; Biden 2020, overstated by 3.2 percentage points. With the exception of 2012, when Obama's cheap (taxpayer-funded) "heroics" in the aftermath of Hurrican Sandy coincided with the final runup to election day, the bias favoring Democrats has grown.
With that background out of the way, I hereby introduce a new metric that I will use for polling trends. First, I will use a 5-poll average. I had been using 10-poll average, which can span polls conducted over a two-week period, or longer. The 10-poll average also (often) includes more than one poll by the same pollster. I then switched to a 3-poll average, with no double-counting of any pollster's results. But a 3-poll average is too "jumpy" (unstable). A 5-poll average (with no double-counting) seems like a good compromise.
Second, after computing the 5-poll average, I adjust it by adding 3.2 percentage points to Trump's margin relative to Biden. That value (the final polling bias against Trump in 2020) corrects for growing pro-Democrat bias, which is probably greater than 3.2 percentage points this year. The result, I believe, is closer to the truth than the polls (on average) would have it because of the prevailing bias toward Biden (and Democrats, generally).
Without further ado, here's how things look:
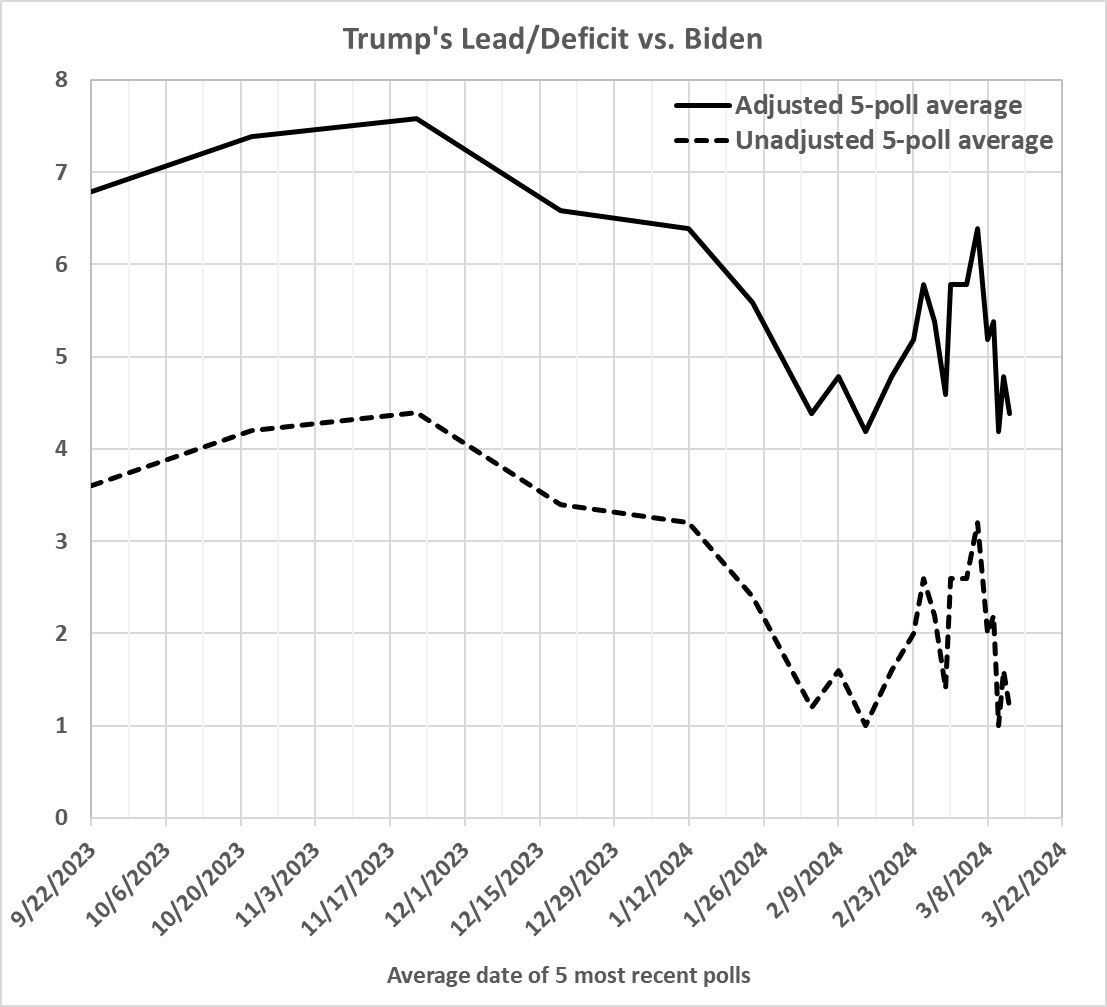
Trump's margin actually peaked last fall, dipped significantly, rebounded somewhat, and dipped again. We'll see if it rebounds again -- and if my revised method yields an estimate that's close to the actual outcome of Election 2024.