

Trump vs. Harris: 2
Trump vs. Harris: 2
Kamala the sphinx gains a little bit of ground.

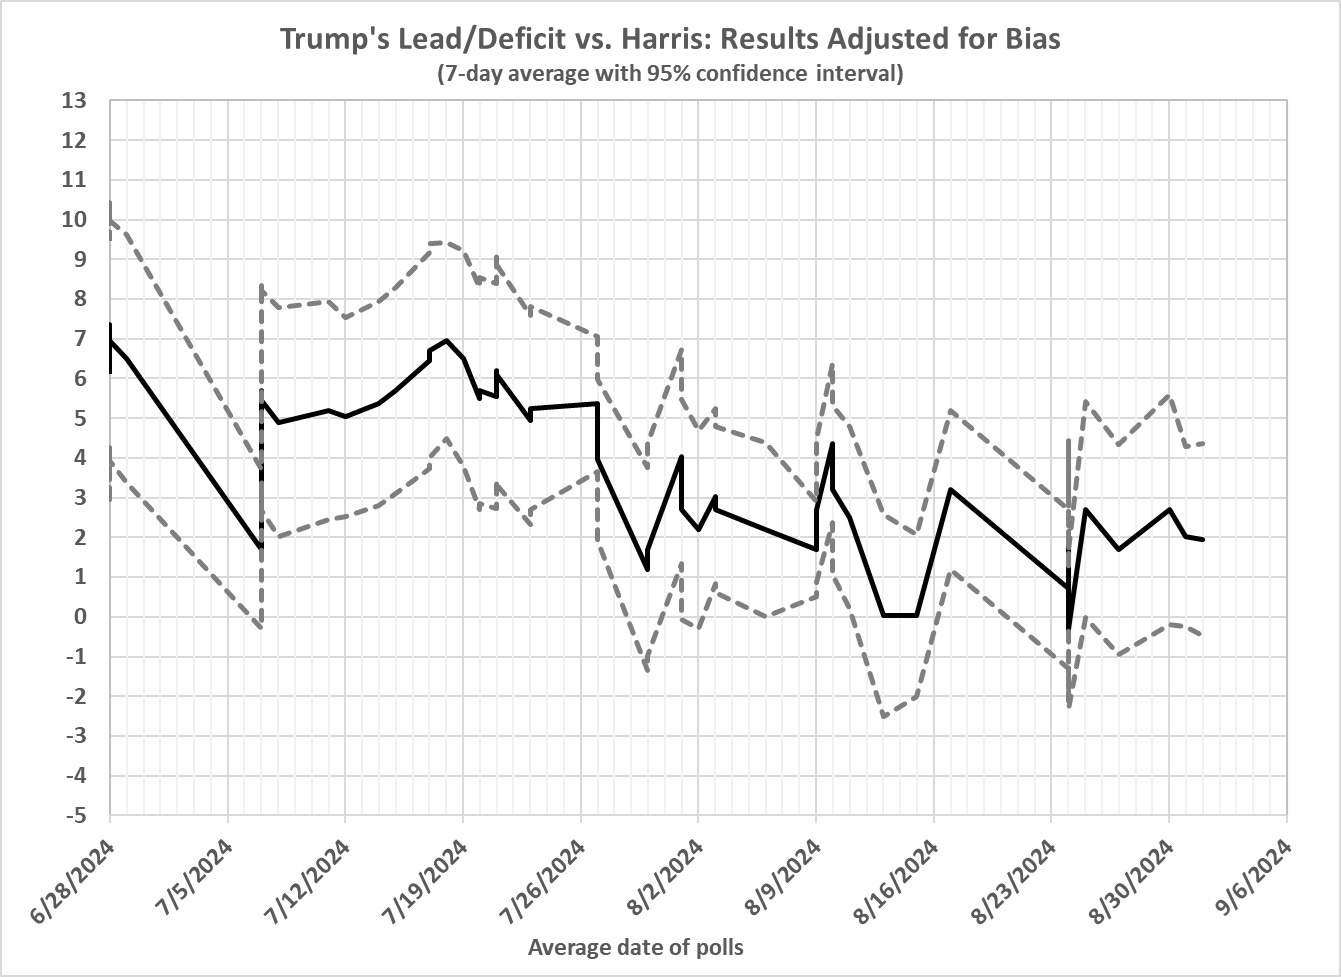
Trump’s position vis-a-vis Harris is a bit weaker than it was on August 14, when I published “Trump vs. Harris: 1 (It’s Still Trump’s Election to Lose)“:
(For details of the computation, see “Trump vs. Harris: 1”.)
How does the current range — a deficit of 1 point to a lead of 4 points — translate into electoral votes? As on August 14, Trump would win 313 to 327 electoral votes if the election were held today:

(See “Trump vs. Biden: 16” for an explanation of the relationship between popular vote/polling margin and electoral votes.)
Not only that, but the polls have been swinging back toward Trump, though he isn’t gaining ground:

Translating poll results into shares of the two-party presidential vote yields an interesting comparison between Harris’s performance and those of Clinton and Biden before her:

First of all, note the pro-Democrat (or anti-Trump biases in 2016 and 2020). The biases are reflected in the differences between the final 7-day polling averages (green and black lines) and the final shares of the nationwide two-party vote (green and black diamonds at 0 days). Clinton lost cleanly with 51.05 percent of the two-party vote. Biden won narrowly, requiring close “wins” in several states, even though he got 52.25 percent of the two-party vote. Harris’s performance still lags Clinton’s.
What it the red line at 53.5 percent? That’s my estimate of what it will take for Harris to register a clear victory over Trump — no razor-thing “victory” in any State and no potentially game-changing outcomes that are close enough to warrant recounts or court challenges. Harris is still a long way from that number.