

Intermission: More Great Hitters
Intermission: More Great Hitters
A special for baseball fans.

The last time I published a post about baseball I lost two subscribers. Perhaps they were disappointed that I wasn’t writing about politics, economics, the state of America, or some other weighty subject. I usually write about weighty subjects, but I like to take an occasional break and dip into lighter fare. This post is such an occasion. Don’t worry, the next several ones will be suitably somber.
This is an elaboration of “Baseball’s Greatest Hitters for Average”. At the outset, I must admit that there’s no definitive way to conclude that so-and-so was baseball’s greatest hitter for a season, for a career, or for a given age. Baseball simply has too much “causal density” for such a determination; for example:
batter’s experience and physical condition
batter’s “handedness” relative to the pitcher’s
batter’s place in the batting order
batting prowess of the next hitter in the lineup
de facto size of the strike zone
height of the pitching mound
condition of the infield
distance to the fences
height of the fences
background distractions (buildings, lights, scoreboards, etc.)
tightness with which the ball is wound
cleanliness and resilience of the ball
repertoire of pitches (legal and illegal)
frequency of pitching changes
size and strength of players
length and weight of bats
size and shape of fielders’ gloves
defensive “shift” (of which Ted Williams was a prominent victim)
predominance of night games
quality of lighting.
and on and on and on.
Such things change from day to day, ballpark to ballpark, and year to year. The multiplicative effect of uncertainties about how all of those factors influence a particular hitter’s performance on a given day, at a given age, for a given season, or over a career swamps the differences in estimates of batting prowess between players.
Here, I am content to identify those players who — for a given season — not only hit for a high average but also displayed exceptional offensive prowess. Such hitters not only get on base safely but also accumulated a goodly number of doubles, triples, and home runs — in addition to singles. They may have also frequently walked (drawn a base on balls, or BB) because fearsome batters and batters who are good judges of the strike zone (overlapping categories) often get on base by walking.
In baseball record-keeping, there is a statistic for total bases on hits (TB), which accounts for whether a hit is a single, double, triple, or home run. (A single counts for one base; a double, for two; and so on.) It’s a simple matter to add BB to TB to get a statistic that I call adjusted total bases (TB*). Divide TB* by the number of a player’s plate appearances (PA) and you have TB*/PA, which is a first approximation of offensive prowess. (Regarding some commonly used alternatives, see footnote *.)
I modified the first approximation to take into account the differences between the two major leagues and season-to-season variations in at least some of the many factors listed above. Specifically, I normalized TB*/PA for a given player in a given season by dividing it by TB*/PA for the league in which a player compiled his record for the season. (For example, a player’s TB*/PA of .400 divided by the league’s TB*/PA of .300 gives a normalized TB*/PA of 1.333.) I tweaked the normalization to account for the fact that TB*/PA for the American League was strongly affected by the adoption of the designated hitter (DH) in 1973** (another statistic that adds to the cloud of uncertainty).
I began with 1890 so that I could span the careers of two legends of the game — Nap Lajoie and Honus Wagner — both of whom played from the 1890s to the 1910s. Further, to avoid the contamination of the “steroid era” of major-league baseball, I considered only TB*/PA through 1990, at which time a new set of leading hitters came on the scene, and made a mockery of the game. (Barry Bonds, I’m looking at you as a leading culprit.)
The graph below depicts each season’s leader in normalized, league-adjusted TB*/PA from 1890 through 1890, where each season’s leader compiled at least 400 PA in that season. Forty different players led the major leagues in TB*/PA over the 101-year span. (See footnote *** for a complete list, with links to each player’s page at Baseball-Reference.com, which is the source of the statistics used in this analysis.)
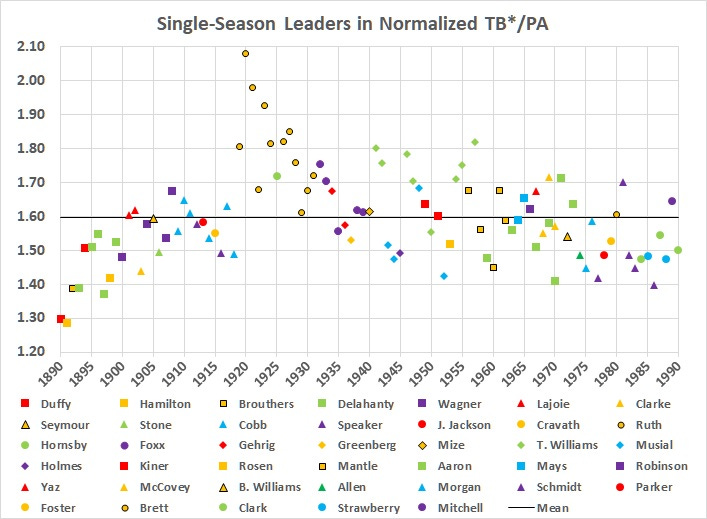
The upward climb to the era of Babe Ruth’s dominance and the subsequent descent are obvious. Ted Williams’s era of dominance is also prominent, though less pronounced.
The table below lists the multi-season leaders in descending order of the number of seasons as leader. (Early players on my list might have recorded more leading seasons had I gone back beyond 1890.)
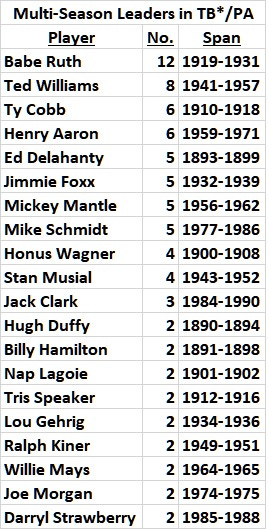
(Ted Williams’s record deserves an asterisk because he lost most of 5 seasons to military service.)
Astute readers will have noticed that the 80-20 rule has been violated. It took 50 percent of the players (20 of 40) to comprise 80 percent of the single-season leaderships (81 of 101). On the other hand, the 40 players were a tiny fraction of the number of major-leaguers who had at least 400 plate appearances in at least one season during the years 1890-1990.
* Slugging percentage omits walks. On-base-plus-slugging (OPS) amounts to convoluted double counting; on-base percentage and slugging percentage are overlapping metrics. OPS also takes account of sacrifice flies (SF) and hit-by-pitcher (HBP) — events that are relatively rare, not necessarily deliberate (on the batter’s part), and which (in the case of SF) haven’t been recorded consistently over time.
** The DH adjustment is .0085, which is the difference between the changes in the American and National Leagues’ TB*/PA between two spans: 1901-1972 and 1973-2022. The AL average increased by .0375 between 1901-1972 and 1973-2022. The NL average increased by .0289 between those two spans. I attribute the difference of .0085 (rounded value) to the AL’s adoption of the DH. I therefore subtracted .0085 from the AL’s TB*/PA for each year from 1973 through 2022.
*** Here’s the list of leaders, in the order of their appearance in the graph above, with the spans of their major-league seasons given in parentheses. The links lead to their pages at Baseball-Reference.com:
Hugh Duffy (1888-1906)
Billy Hamilton (1888-1901)
Dan Brouthers (1879-1904)
Ed Delahanty (1888-1903)
Honus Wagner (1897-1917)
Nap Lajoie (1896-1916)
Fred Clarke (1894-1915)
Cy Seymour (1896-1913)
George Stone (1903-1910)
Ty Cobb (1905-1928)
Tris Speaker (1907-1928)
Joe Jackson (1908-1920)
Gavvy Cravath (1908-1920)
Babe Ruth (1914-1935)
Rogers Hornsby (1915-1937)
Jimmie Foxx (1925-1945)
Lou Gehrig (1923-1939)
Hank Greenberg (1930-1947)
Johnny Mize (1936-1953)
Ted Williams (1939-1960)
Stan Musial (1941-1963)
Tommy Holmes (1942-1952)
Ralph Kiner (1946-1955)
Al Rosen (1947-1956)
Mickey Mantle (1951-1968)
Henry Aaron (1954-1976)
Willie Mays (1948-1973)
Frank Robinson (1956-1976)
Carl Yastrzemski (1961-1983)
Willie McCovey (1959-1980)
Billy Williams (1959-1976)
Dick Allen (1963-1977)
Joe Morgan (1963-1984)
Mike Schmidt (1972-1989)
Dave Parker (1973-1991)
George Foster (1969-1986)
George Brett (1973-1993)
Jack Clark (1975-1992)
Darryl Strawberry (1983-1999)
Kevin Mitchell (1984-1998)