

Stats and Commentary: January 14, 2023
Stats and Commentary: January 14, 2023
Presidential popularity, GDP, CPI, and whatever else strikes my fancy.

Presidential Popularity: Obama, Trump, Biden
I have followed the Presidential Tracking Poll at Rasmussen Reports* since 2008. The straightforward Approval Index (strongly approve minus strongly disapprove) doesn’t quite capture the way that likely voters assess a president’s performance. So I concocted an “enthusiasm ratio” — the number of likely voters who strongly approve as a percentage of the number of likely voters who venture an opinion one way or the other (thus omitting the voters who are non-committal). Here’s a comparison of the enthusiasm ratios for Obama (first term), Trump, and Biden:
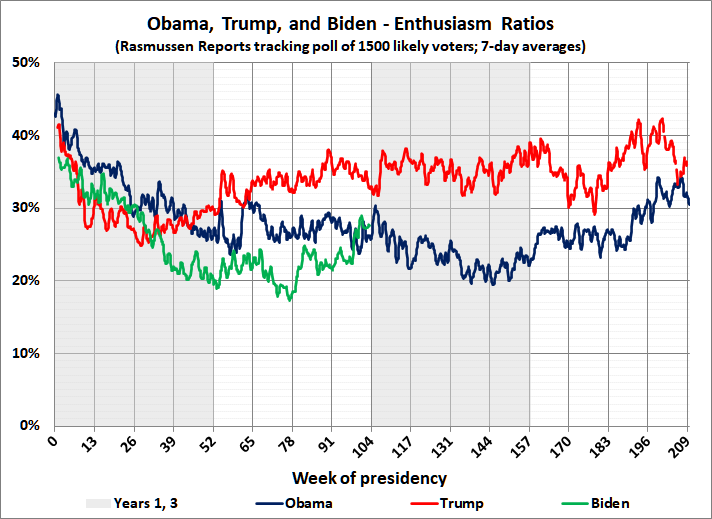
You might ask how Biden has caught up with Obama. I have no answer other than the fact that most voters have short memories and care little about the consequences of leftist governance. Some of those consequences are in evidence below.
GDP Trends
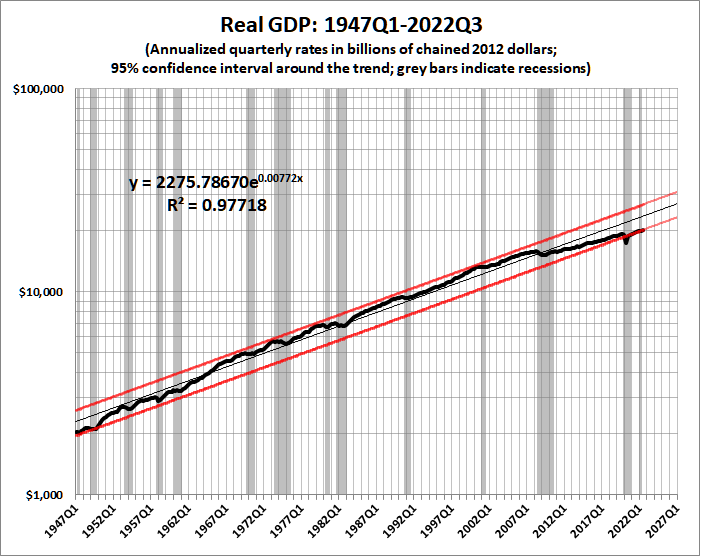
The exponential trend line indicates a constant-dollar (real) growth rate for the entire period of 0.77 percent quarterly, or 3.1 percent annually. The actual beginning-to-end annual growth rate is also 3.1 percent.
The red bands parallel to the trend line delineate the 95-percent (1.96 sigma) confidence interval around the trend. GDP has been below the confidence interval since the government-induced pandemic recession of 2020. Come to think of it, the back-to-back recessions of 1980-1982 and the Great Recession of 2008-2010 were also government-caused — the government in those cases being the Federal Reserve. The short recession of 2022, which may soon be followed by another one, can also be chalked up to the Fed.
In any event, the tailing off of real GDP growth since 2000 is the handiwork of government spending and regulatory policies. For much more about that plague, which has existed for more than a century, see this and this.
Unemployment
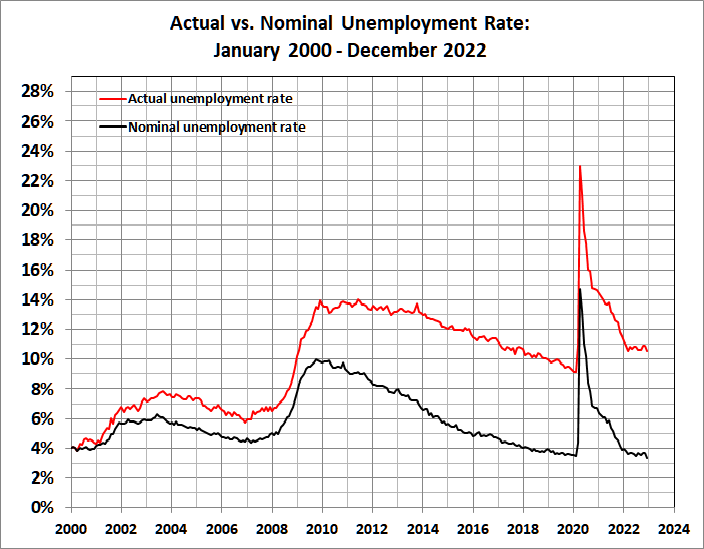
The government-reported unemployment rate of 3.3 percent for December 2022 is actually 10.5 percent. What the government doesn’t publicize is the labor-force participation rate, which has dropped from its January 2000 peak of 67.3 percent to 62.2 percent. See this post for details of the calculation. Here’s an up-to-date graph of nominal vs. actual unemployment rates:
Consumer Price Index
The index of prices for urban consumers (CPI-U) is the one that gets the headlines. There has been much ado in recent days about the drop in the rate of inflation, which only means that prices (as measured by the Bureau of Labor Statistics) aren’t rising quite as rapidly as they had been.
Here’s how things looked as of December 2022:
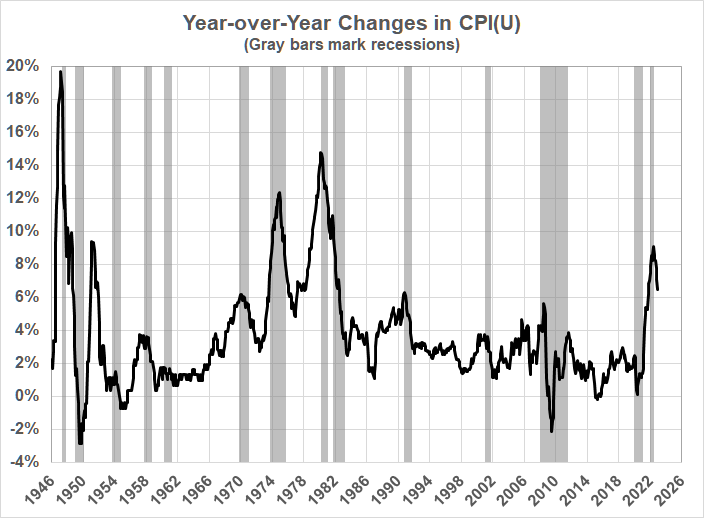
I don’t take any solace in the fact that the most recent year-over-year rate — 6.45 percent — means that prices double every 11 years. Back in the good old days when inflation was running in the neighborhood of 2 percent, prices would be expected to double every 36 years. An average Joe — not the idiot in the White House — could live with that. Now, he’s scrambling to pay his bills, probably with credit debt that is becoming more expensive to carry.
That’s enough for today. I’ll update this occasionally — and add to it.
* I follow Rasmussen Reports because of its good track record — here and here, for example. Though the Rasmussen polls are generally accurate, they are out of step with the majority of polls, which are biased toward Democrats. This has caused Rasmussen Reports to be labeled “Republican-leaning”, as if the other polls aren’t “Democrat-leaning”.