

The State of the Economy and the Myth of the "Red Hot" Labor Market
The State of the Economy and the Myth of the "Red Hot" Labor Market
Lying liars and the lies they tell.

I’ll start with a look at the state of the economy before turning to the labor market.
The Bureau of Economic Analysis (BEA) issues a quarterly estimate of constant-dollar (year 2009) GDP, from 1947 to the present. BEA’s numbers yield several insights about the course of economic growth in the U.S.
I begin with this graph:
FIGURE 1

The exponential trend line indicates a constant-dollar (real) growth rate for the entire period of 0.77 percent quarterly, or 3.1 percent annually. The actual beginning-to-end annual growth rate is 3.1 percent.
The red bands parallel to the trend line delineate the 95-percent (1.96 sigma) confidence interval around the trend. GDP has been below the confidence interval since the recession of 2020, which has been succeeded by the incipient recession of 2022.
Recessions are represented by the vertical gray bars in figure 1. Here’s my definition of a recession: two or more quarters in which real GDP (annualized) is below real GDP (annualized) for an earlier quarter.
Recessions as I define them don’t correspond exactly to recessions as defined by the National Bureau of Economic Research (NBER). NBER, for example, dates the Great Recession from December 2007 to June 2009 — 18 months in all; whereas, I date it from the first quarter of 2008 through the second quarter of 2011 — 42 months in all. The higher figure seems right to me, and probably to most people who bore the brunt of the Great Recession (i.e., prolonged joblessness, loss of savings, foreclosure on home, bankruptcy).
My method of identifying recessions is more objective and consistent than the NBER’s method, which one economist describes as “The NBER will know it when it sees it.” Moreover, unlike the NBER, I would not presume to pinpoint the first and last months of a recession, given the volatility of GDP estimates.
The following graph illustrates that volatility, and something much worse — the downward drift of the rate of real economic growth:
FIGURE 2
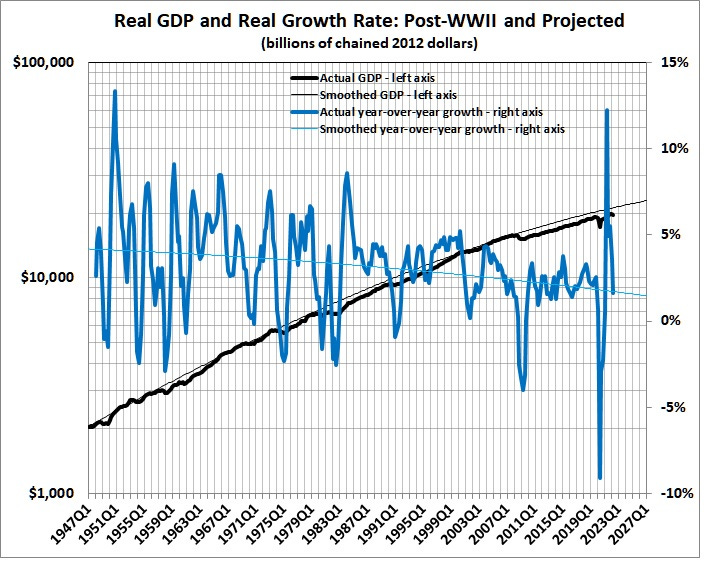
It’s not a pretty picture. The dead hand of the “tax, spend, and regulate” economy lies heavy on the economy. (See “The Bad News about Economic Growth”.)
Here’s another ugly picture:
FIGURE 3

Rates of growth (depicted by the exponential regression lines) clearly are lower in later cycles than in earlier ones, and lowest of all represents the 2009-2020 cycle (the most recent of completed cycles).
In tabular form:

There is a statistically significant, negative relationship between the length of a cycle and the robustness of a recovery. But the 2009-2020 cycle (represented by the data point at 2 months and 3.0% growth) stands out as an exception:
FIGURE 4

Note: The first, and brief, post-World War II cycle is omitted.
By now, it should not surprise you to learn that the 2009-2020 cycle was the weakest of all post-war cycles (though the previous one took a dive when it ended in the Great Recession):
FIGURE 5

Which brings me to the labor market. How can it be “red hot” when the economy is obviously so weak? In a phrase, it isn’t.
The real unemployment rate is several percentage points above the nominal rate. Officially, the unemployment rate stood at 3.5 percent as of July 2022. Unofficially — but in reality — the unemployment rate was 10.8 percent.
How can I say that the real unemployment rate was 10.8 percent, even though the official rate was 3.5 percent? Easily. Just follow this trail of definitions, provided by the official purveyor of unemployment statistics, the Bureau of Labor Statistics:
Unemployed persons (Current Population Survey)
Persons aged 16 years and older who had no employment during the reference week, were available for work, except for temporary illness, and had made specific efforts to find employment sometime during the 4-week period ending with the reference week. Persons who were waiting to be recalled to a job from which they had been laid off need not have been looking for work to be classified as unemployed.Unemployment rate
The unemployment rate represents the number unemployed as a percent of the labor force.Labor force (Current Population Survey)
The labor force includes all persons classified as employed or unemployed in accordance with the definitions contained in this glossary.Labor force participation rate
The labor force as a percent of the civilian noninstitutional population.Civilian noninstitutional population (Current Population Survey)
Included are persons 16 years of age and older residing in the 50 States and the District of Columbia who are not inmates of institutions (for example, penal and mental facilities, homes for the aged), and who are not on active duty in the Armed Forces.
In short, if you are 16 years of age and older, not confined to an institution or on active duty in the armed forces, but have not recently made specific efforts to find employment, you are not (officially) a member of the labor force. And if you are not (officially) a member of the labor force because you have given up looking for work, you are not (officially) unemployed — according to the BLS. Of course, you are really unemployed, but your unemployment is well disguised by the BLS’s contorted definition of unemployment.
What has happened is this: Since the first four months of 2000, when the labor-force participation rate peaked at 67.3 percent, it declined to 62.3 percent in 2015 before rising to 63.4 percent just before the pandemic wreaked havoc on the economy. The participation rate dropped to 60.2 percent during the COVID recession before recovering to a post-recession peak of 62.4 percent and dropping to 62.1 percent in July 2022 (during what may prove to be another recession). The post-recession recovery still leaves the participation rate well below its (depressed but recovering) pre-recession level:
FIGURE 6

Source: See figure 7.
The decline that began in 2000 came to a halt in 2005, but resumed in late 2008. The economic slowdown in 2001 (which followed the bursting of the dot-com bubble) can account for the decline through 2005, as workers chose to withdraw from the labor force when faced with dimmer employment prospects. But what about the sharper decline that began near the end of Bush’s second term?
There we see not only the demoralizing effects of the Great Recession but also the growing allure of incentives to refrain from work, namely, disability payments, extended unemployment benefits, the relaxation of welfare rules, the aggressive distribution of food stamps, and “free” healthcare” for an expanded Medicaid enrollment base and 20-somethings who live in their parents’ basements*. That’s on the supply side. On the demand side, there are the phony and even negative effects of “stimulus” spending; the chilling effects of regime uncertainty, persisted beyond the official end of the Great Recession; and the expansion of government spending and regulation (e.g., Dodd-Frank), as discussed in Part III.
More recently, COVID caused many workers to withdraw from the labor force out of an abundance of caution, because they couldn’t work from home, and because of the resulting recession. As noted, the recovery has stalled, resulting in a low but phony unemployment rate.
I constructed the actual unemployment rate by adjusting the nominal rate for the change in the labor-force participation rate. The disparity between the actual and nominal unemployment rates is evident in this graph:
FIGURE 7

Derived from SeriesLNS12000000, Seasonally Adjusted Employment Level; SeriesLNS11000000, Seasonally Adjusted Civilian Labor Force Level; Series LNS11300000, Seasonally Adjusted Civilian labor force participation rate; and Series LNS12500000, Employed, Usually Work Full Time. All are available at BLS, Labor Force Statistics from the Current Population Survey.
So, forget the Biden administration’s hoopla about the “red hot” labor market. The real unemployment rate has actually risen recently and is about where it was at the beginning of the Trump administration .
_________
* Contrary to some speculation, the labor-force participation rate is not declining because older workers are retiring earlier. The participation rate among workers 55 and older rose between 2002 and 2012. The decline is concentrated among workers under the age of 55, and especially workers in the 16-24 age bracket. (See this table at BLS.gov.) Why? My conjecture: The Great Recession caused a shakeout of marginal (low-skill) workers, many of whom simply dropped out of the labor market. And it became easier for them to drop out because, under Obamacare, many of them became eligible for Medicaid and many others enjoy prolonged coverage (until age 26) under their parents’ health plans. For more on this point, see Salim Furth’s “In the Obama Economy, a Decline in Teen Workers” (The Daily Signal, April 11, 2015), and Stephen Moore’s “Why Are So Many Employers Unable to Fill Jobs?” (The Daily Signal, April 6, 2015). On the general issue of declining participation among males aged 25-54, see Timothy Taylor’s “Why Are Men Detaching from the Labor Force?“, (The Conversible Economist, January 16, 2020), and follow the links therein. See also Scott Winship’s “Declining Prime-Age Male Labor Force Participation” (The Bridge, Mercatus Center, September 26, 2017). More recently, there have been rounds of “stimmies” issued by the federal government and some State governments in response to the COVID crisis (inflicted by the governments). The “stimmies” were topped off by extended, expanded, and downright outlandish unemployment benefits (e.g., these).