

Stats and Commentary: January 31, 2023
Stats and Commentary: January 31, 2023
Presidential popularity, GDP, CPI, and whatever else strikes my fancy.

Presidential Popularity: Obama, Trump, Biden
I have followed the Presidential Tracking Poll at Rasmussen Reports* since Obama was elected in 2008. The straightforward Approval Index (strongly approve minus strongly disapprove) doesn’t quite capture the way that likely voters assess a president’s performance. So I concocted an “enthusiasm ratio” — the number of likely voters who strongly approve as a percentage of the number of likely voters who venture an opinion one way or the other (thus omitting the voters who are non-committal). Here’s a comparison of the enthusiasm ratios for Obama (first term), Trump, and Biden:
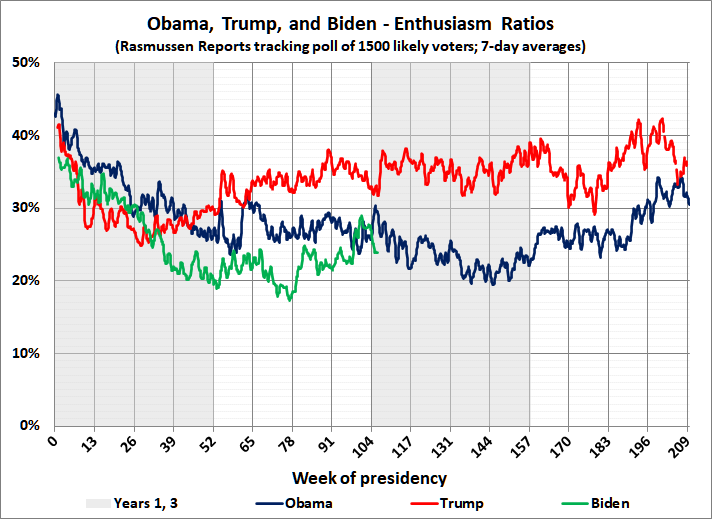
You might ask how Biden caught up with Obama. I have no answer other than the fact that most voters have short memories and care little about the consequences of leftist governance. The recent dip in Biden’s standing is probably the result of the discovery of classified documents in various locations — and the growing awareness that those documents were used in the influence-peddling business fronted by Hunter Biden.
Right Direction or Wrong Track
Rasmussen Reports also publishes a weekly poll in which 1,500 likely voters are asked whether the country is going in the right direction or is on the wrong track. The results, as you would expect, are volatile — reflecting the recent headlines and media spin. Government shutdowns, for example, which are actually good news, are widely viewed as bad news. Here are the weekly results since Obama took office in January 2009:
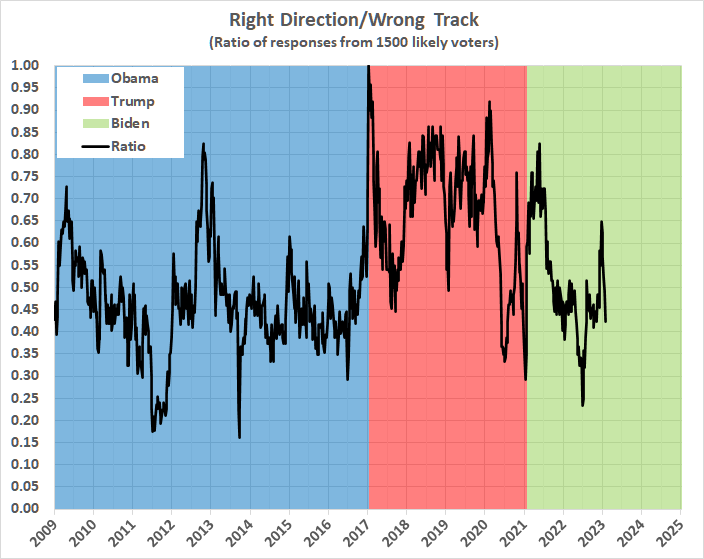
The mood of the voters polled during Trump’s term in office never reached the depths that it reached under Obama. Biden is following in Obama’s footsteps, and he has two more years in which to reach a new low — unless he is impeached and removed from office for his influence-peddling business.
GDP Trends
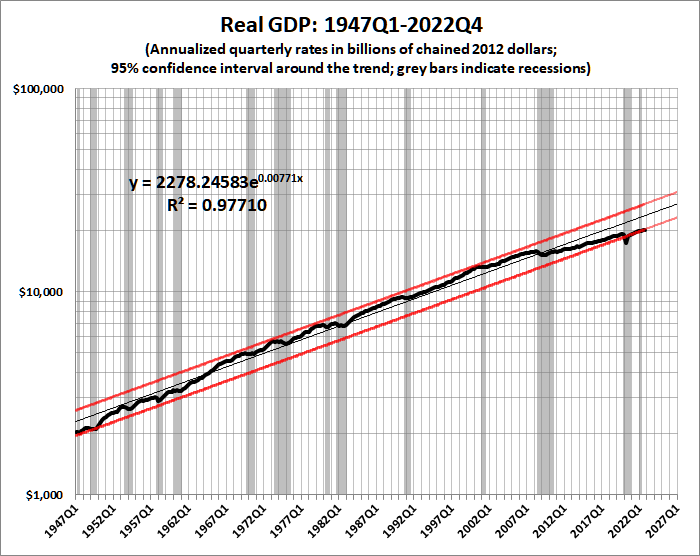
The exponential trend line indicates a constant-dollar (real) growth rate for the entire period of 0.77 percent quarterly, or 3.1 percent annually. The actual beginning-to-end annual growth rate is also 3.1 percent.
The red bands parallel to the trend line delineate the 95-percent (1.96 sigma) confidence interval around the trend. GDP has been below the confidence interval since the government-induced pandemic recession of 2020. Come to think of it, the back-to-back recessions of 1980-1982 and the Great Recession of 2008-2010 were also government-caused — the government in those cases being the Federal Reserve. The short recession of 2022, which may soon be followed by another one, can also be chalked up to the Fed.
Here’s another depiction of the general decline in real economic growth:
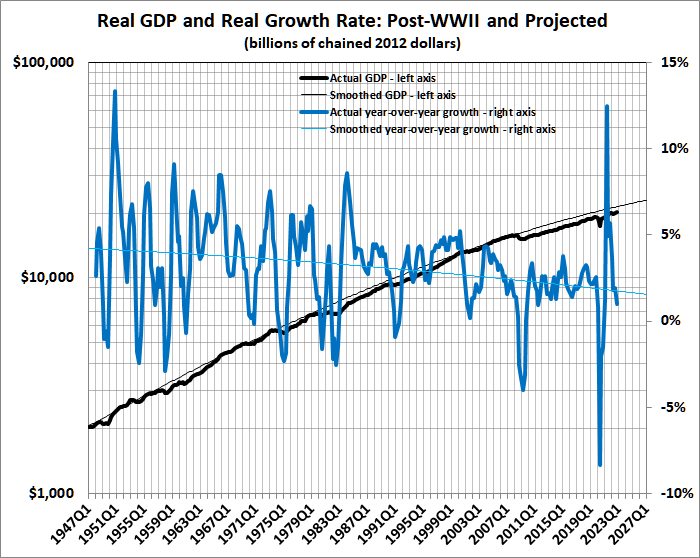
And here’s another view:
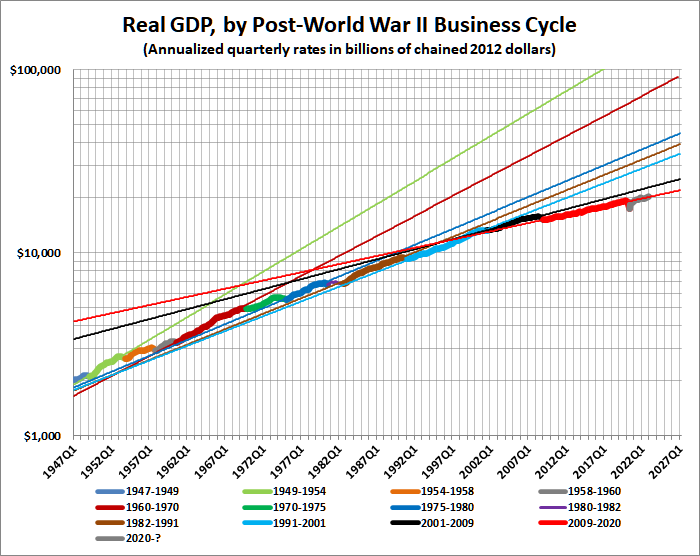
The trend lines, which reflect the rate of growth during each business cycle, are getting progressively “flatter”, that is, the rate of growth (with a few exceptions) is dropping from cycle to cycle.
However you look at it, the steady decline in real GDP growth is the handiwork of government spending and regulatory policies. For much more about that plague, which has existed for more than a century, see this and this.
That’s enough for today. I’ll update this occasionally, and come back to the unemployment rate and CPI, which I discussed in the first edition of this post.
* I follow Rasmussen Reports because of its good track record — here and here, for example. Though the Rasmussen polls are generally accurate, they are out of step with the majority of polls, which are biased toward Democrats. This has caused Rasmussen Reports to be labeled “Republican-leaning”, as if the other polls aren’t “Democrat-leaning”.