

Stats and Commentary: May 10, 2023
Stats and Commentary: May 10, 2023
Economics and politics by the numbers.

GDP Trends
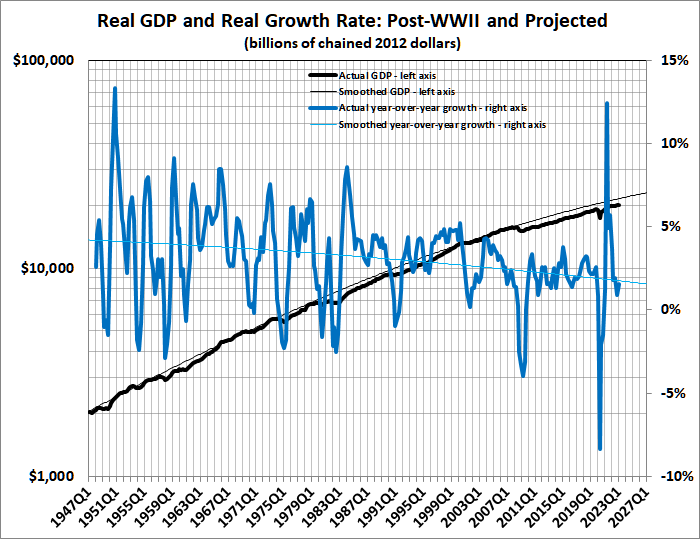
Here’s the latest, including the first (April 2023) estimate of GDP in the first quarter of 2023:

The exponential trend line indicates a constant-dollar (real) growth rate for the entire period of 0.77 percent quarterly, or 3.1 percent annually. The actual beginning-to-end annual growth rate is also 3.1 percent.
The red bands parallel to the trend line delineate the 95-percent (1.96 sigma) confidence interval around the trend. GDP has been below the confidence interval since the government-induced pandemic recession of 2020. Come to think of it, the back-to-back recessions of 1980-1982 and the Great Recession of 2008-2010 were also government-caused — the government in those cases being the Federal Reserve. The short recession of 2022, which may soon be followed by another one, can also be chalked up to the Fed.
Here’s another depiction of the general decline in real economic growth:
And here’s another view:

The trend lines, which reflect the rate of growth during each business cycle, are getting progressively “flatter”, that is, the rate of growth (with a few exceptions) is dropping from cycle to cycle.
However you look at it, the steady decline in real GDP growth is the handiwork of government spending and regulatory policies. For much more about that plague, which has existed for more than a century, see this and this.
Unemployment
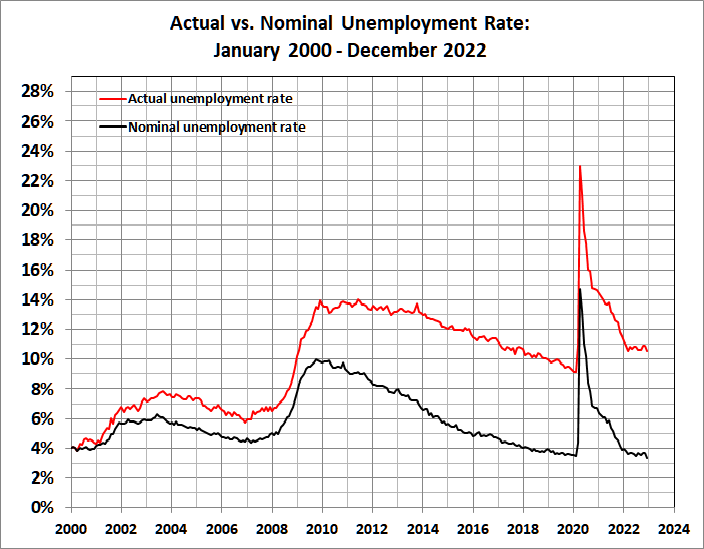
The government-reported unemployment rate of 3.4 percent for April 2023 is actually 10.1 percent. What the government doesn’t publicize is the labor-force participation rate, which has dropped from its January 2000 peak of 67.3 percent to 62.6 percent. (See this post for details of the calculation.) Here’s an up-to-date graph of nominal vs. actual unemployment rates:
The good news is that the labor-force participation rate is on the rise:
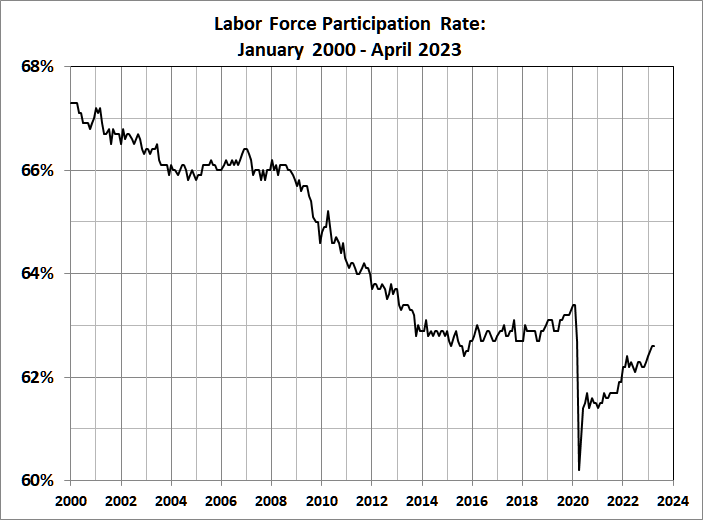
That’s a good sign for inflation. Perhaps it will actually “cool” — but it has a long way to go.
Inflation
The index of prices for urban consumers (CPI-U) is the one that gets the headlines. There has been much ado in recent days about the drop in the rate of inflation, which only means that prices (as measured by the Bureau of Labor Statistics) aren’t rising quite as rapidly as they had been.
Here’s how things looked through April 2023:

Today’s big headline in the leftist media is that inflation “cooled” to an annual rate of 4.9 percent. Big whoop! It “cooled” from 4.98 percent to 4.93 percent, a difference that is surely well within the margin of error for CPI statistics. Moreover, the four-quarter average of annualized monthly readings has been rising since December 2022 and is now 6.81 percent.
Rumors of the demise of inflation are premature.
The Stock Market
A bear market is usually defined as decline of at least 20 percent in a broad stock-market index. The S&P 500 index topped out at 4818.22 in January 2022, dropped to 3636.87 in June, rose to 4325.28 in August, dropped to 3491.58 in October — the low (to date) for the current bear market, 27 percent below the January peak.
Since then, the index has risen, dropped, and risen again. Yesterday’s closing price of 4119.17 left the index almost 15 percent below its peak. Technically (and arbitrarily), the market is no longer in bear country, but that doesn’t mean that the bear market is over.
Here’s the story to date:
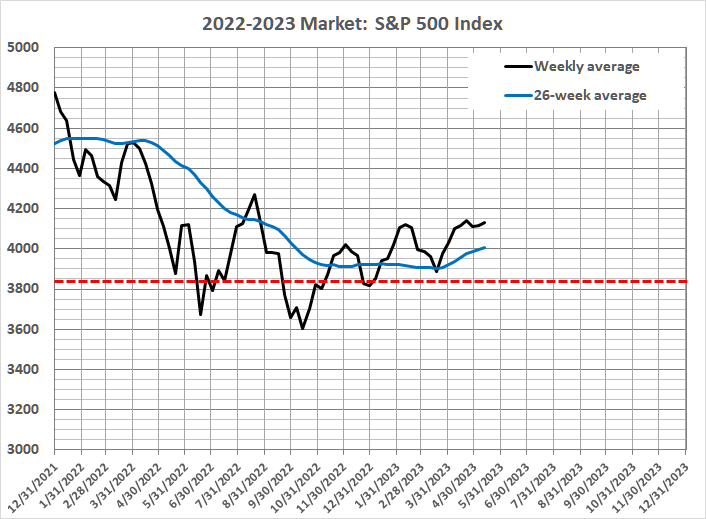
The dashed red line is 20 percent below the January 2022 high. The meandering route of the weekly average (which I use for analysis of long-term trends) has taken the index above the “magic” 20-percent line more than once.
The indicators that I use suggest that the bear market is over. Now, the question is how long the current (weak) bull market will last. There’s no guarantee that the market won’t take another dive before it reaches the January 2022 peak. There were back-to-back bear markets in 2000-2003. And after the collapse of 2007-2009, the market didn’t return to its (nominal) pre-crash peak until four years after it had hit bottom.
As the man said, the market is a random walk down Wall Street. Anything can happen, and it usually does: war, riot, natural disaster, political turmoil, unexpectedly bad or good economic news, etc., etc., etc.
Stay tuned.
Presidential Popularity: Obama, Trump, Biden
I have followed the Presidential Tracking Poll at Rasmussen Reports* since Obama was elected in 2008. The straightforward Approval Index (strongly approve minus strongly disapprove) doesn’t quite capture the way that likely voters assess a president’s performance. So I concocted an “enthusiasm ratio” — the number of likely voters who strongly approve as a percentage of the number of likely voters who venture an opinion one way or the other (thus omitting the voters who are non-committal). Here’s a comparison of the enthusiasm ratios for Obama (first term), Trump, and Biden (through 05/10/23):

You might ask how Biden caught up with Obama. I have no answer other than the fact that most voters have short memories and seem to care little about the consequences of leftist governance. It will take a major change to move the needle downward; for example, irrefutable proof of Biden’s direct involvement in the family influence-peddling business. Even better, irrefutable proof that some of the classified documents found in various places owned or controlled by Joe were used by Hunter in the conduct of said business.
Right Direction or Wrong Track
Rasmussen Reports also publishes a weekly poll in which 1,500 likely voters are asked whether the country is going in the right direction or is on the wrong track. The results, as you would expect, are volatile — reflecting the recent headlines and media spin. Government shutdowns, for example, which are actually good news, are widely viewed as bad news. Here are the comparative results for the presidencies of Obama, Trump, and Biden (through 05/08/23):
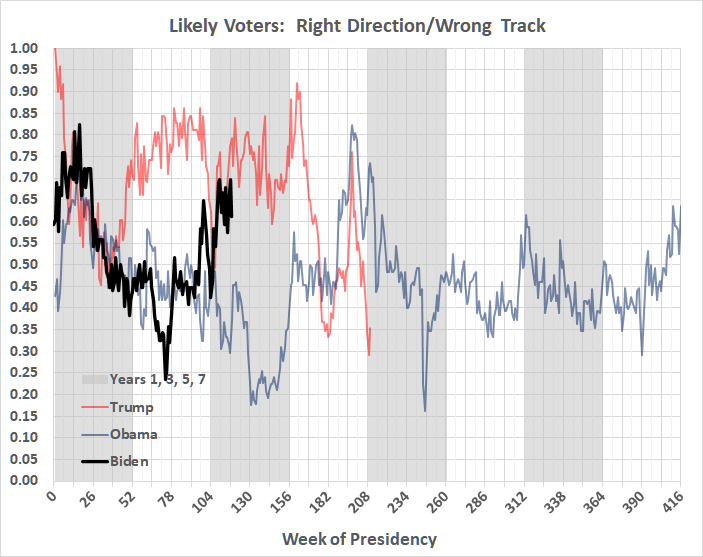
The mood of the voters polled during Trump’s term in office never reached the depths that it reached under Obama. Biden has challenged Obama’s lows but is now in Trump territory. How long will he stay there? See the discussion of presidential popularity, above.